Multiple Choice
Figure 27-1
The following figure shows a utility function for Ren. 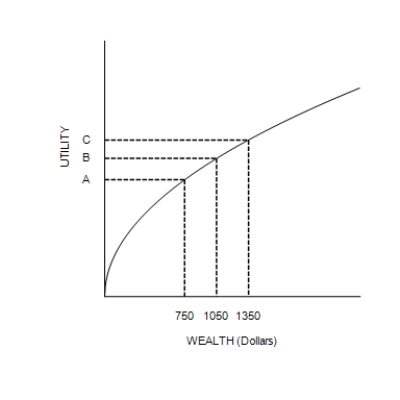
-Refer to Figure 27-1. Suppose the vertical distance between the points (0, A) and (0, B) is 9. If his wealth increased from $1,050 to $1,350, then
A) Ren's subjective measure of his well-being would increase by less than 9 units.
B) Ren's subjective measure of his well-being would increase by more than 9 units.
C) Ren would change from being a risk-averse person into a person who is not risk averse.
D) Ren would change from being a person who is not risk averse into a risk-averse person.
Correct Answer:

Verified
Correct Answer:
Verified
Q124: According to the efficient markets hypothesis, at
Q125: Which of the following is not consistent
Q126: The largest reduction in a portfolio's risk
Q127: Fundamental analysis shows that Quadrangle Company is
Q128: If the efficient markets hypothesis is correct,
Q130: Which of the following pairs of portfolios
Q131: Suppose your uncle offers you $200 today
Q132: Scenario 27-2<br><br>Suppose Dave has a utility
Q133: Define the efficient markets hypothesis.
Q134: Suppose you are deciding whether or not