Multiple Choice
Figure 27-3
The following figure shows a utility function for Dexter. 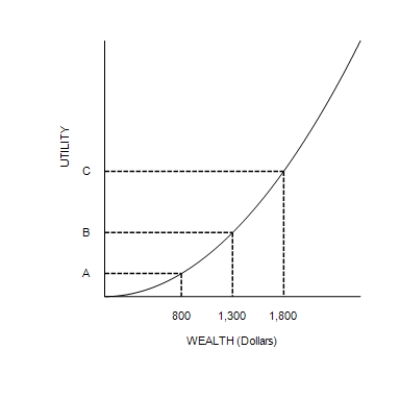
-Refer to Figure 27-3. From the appearance of the graph, we know that
A) Dexter's level of satisfaction increases by more when his wealth increases from $1,001 to $1,002 than it does when his wealth increases from $1,000 to $1,001.
B) Dexter's level of satisfaction increases by less when his wealth increases from $1,001 to $1,002 than it does when his wealth increases from $1,000 to $1,001.
C) Dexter's level of satisfaction increases by the same amount when his wealth increases from $1,001 to $1,002 as it does when his wealth increases from $1,000 to $1,001.
D) the change in Dexter's level of satisfaction is constant as wealth increases.
Correct Answer:

Verified
Correct Answer:
Verified
Q145: If a person had increasing marginal utility,
Q146: Alivia deposited $3,000 into an account two
Q147: You are tearing down a building and
Q148: Figure 27-3<br>The following figure shows a utility
Q149: Fundamental analysis shows that Johnson's Lumber Corporation's
Q151: Kayla faces risks and she pays a
Q152: Actively managed mutual funds usually fail to
Q153: The value of a stock depends on
Q154: Suppose you place $500 into a savings
Q155: Which of the following is the correct