Multiple Choice
Figure 27-3
The following figure shows a utility function for Dexter. 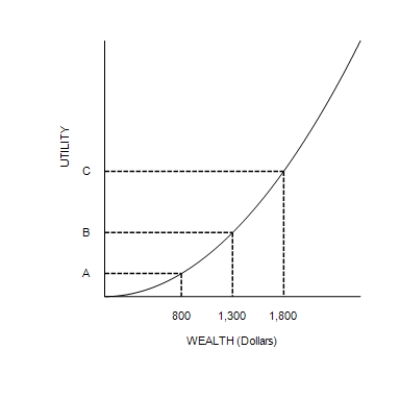
-Refer to Figure 27-3. Suppose the vertical distance between the points (0, A) and (0, B) is 12. If his wealth increased from $1,300 to $1,800, then
A) Dexter's subjective measure of his well-being would increase by less than 12 units.
B) Dexter's subjective measure of his well-being would increase by more than 12 units.
C) Dexter would change from being a risk-averse person into a person who is not risk averse.
D) Dexter would be more likely to buy insurance.
Correct Answer:

Verified
Correct Answer:
Verified
Q20: Risk-averse persons will take no risks.
Q21: Mixster Concrete Company is considering buying a
Q22: Table 27-1<br><br> <span class="ql-formula" data-value="\text
Q23: Assuming the interest rate is 6 percent,
Q24: Available evidence indicates that stock prices, even
Q26: The rule of 70 applies to a
Q27: Kevin recently received an inheritance, and he
Q28: Russell holds stocks in four companies. If
Q29: You are a financial advisor and a
Q30: At about what number of companies does