Figure 26-3 The Figure Shows Two Demand-For-Loanable-Funds Curves and Two Supply-Of-Loanable-Funds Curves
Multiple Choice
Figure 26-3
The figure shows two demand-for-loanable-funds curves and two supply-of-loanable-funds curves.
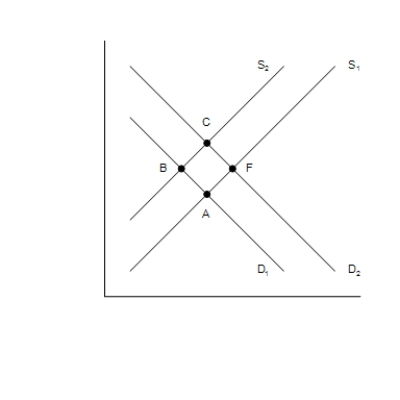
-Refer to Figure 26-3. A shift of the demand curve from D1 to D2 is called
A) a decrease in the quantity of loanable funds demanded.
B) an increase in the demand for loanable funds.
C) an increase in the quantity of loanable funds demanded.
D) a decrease in the demand for loanable funds.
Correct Answer:

Verified
Correct Answer:
Verified
Q177: Congress and the President implement an investment
Q178: Bonds issued by state and local governments
Q179: Consider a closed economy. In which of
Q180: In the terminology of macroeconomics, what's the
Q181: You hold bonds issued by the city
Q183: Mutual funds are a type of financial
Q184: Which of the following statements is correct?<br>A)The
Q185: As an alternative to selling shares of
Q186: Corporations receive no proceeds from the resale
Q187: Long-term bonds are<br>A)riskier than short-term bonds, and