Short Answer
Figure 21-17
The graph shows two budget constraints for a consumer.
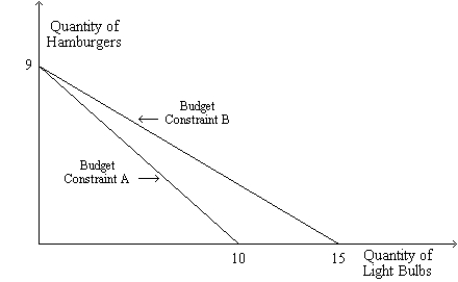
-Refer to Figure 21-17. Suppose the consumer's income is $90 and Budget Constraint A applies. What is the price of a light bulb?
Correct Answer:

Verified
The price ...View Answer
Unlock this answer now
Get Access to more Verified Answers free of charge
Correct Answer:
Verified
View Answer
Unlock this answer now
Get Access to more Verified Answers free of charge
Q87: Figure 21-6 <img src="https://d2lvgg3v3hfg70.cloudfront.net/TB7555/.jpg" alt="Figure 21-6
Q88: Suppose Joshua has budgeted $300 of his
Q89: Shelley wins $1 million in her state's
Q90: Suppose a consumer has an income of
Q91: Suppose William can choose between the consumption
Q93: When the price of a normal good
Q94: Table 21-2<br>A consumer likes two goods:
Q95: Table 21-2<br>A consumer likes two goods:
Q96: The indifference curves for perfect substitutes are
Q97: Suppose at the consumer's current consumption bundle