Essay
Figure 21-17
The graph shows two budget constraints for a consumer.
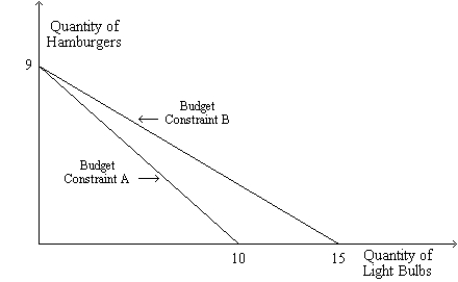
-Refer to Figure 21-17. Suppose the price of a light bulb is $3 and Budget Constraint B applies. What is the consumer's income? What is the price of a hamburger?
Correct Answer:

Verified
The consumer's incom...View Answer
Unlock this answer now
Get Access to more Verified Answers free of charge
Correct Answer:
Verified
View Answer
Unlock this answer now
Get Access to more Verified Answers free of charge
Q18: Using the graph shown, construct a demand
Q19: At a consumer's optimal choice, the consumer
Q20: For a typical consumer, indifference curves can
Q21: Assume that a consumer faces the following
Q22: Figure 21-18<br>The figure shows two indifference curves
Q24: The income effect of a price change
Q25: Figure 21-17<br>The graph shows two budget constraints
Q26: When a consumer spends less time enjoying
Q27: The rate at which a consumer is
Q28: Figure 21-19<br>The figure shows three indifference curves