Multiple Choice
Figure 21-2
In each case, the budget constraint moves from BC1 to BC2.
Graph (a)
Graph (b)
Graph (c)
Graph (d) 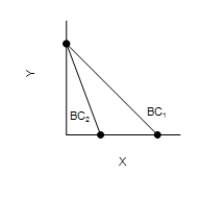
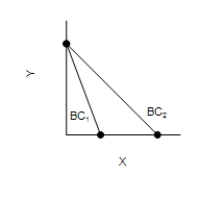
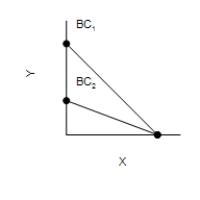
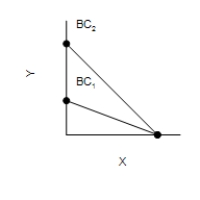
-Refer to Figure 21-2. Which of the graphs in the figure reflects an increase in the price of good X only?
A) Graph (b)
B) Graph (a)
C) Graph (c)
D) Graph (d)
Correct Answer:

Verified
Correct Answer:
Verified
Q93: When the price of a normal good
Q94: Table 21-2<br>A consumer likes two goods:
Q95: Table 21-2<br>A consumer likes two goods:
Q96: The indifference curves for perfect substitutes are
Q97: Suppose at the consumer's current consumption bundle
Q99: Figure 21-9<br><br>Graph (a)<br>Graph (b)<br>Graph (c) <img src="https://d2lvgg3v3hfg70.cloudfront.net/TB7555/.jpg"
Q100: The slope at any point on an
Q101: Figure 21-18<br>The figure shows two indifference curves
Q102: Figure 21-6 <img src="https://d2lvgg3v3hfg70.cloudfront.net/TB7555/.jpg" alt="Figure 21-6
Q103: Tyler consumes two goods, wheat and steak.