Multiple Choice
Figure 21-2
In each case, the budget constraint moves from BC1 to BC2.
Graph (a)
Graph (b)
Graph (c)
Graph (d) 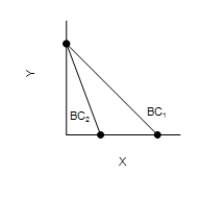
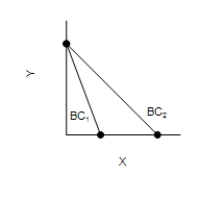
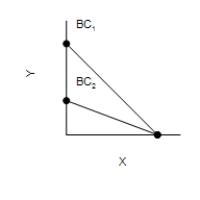
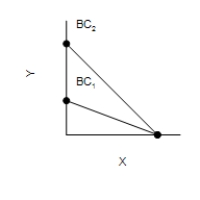
-Refer to Figure 21-2. Which of the graphs in the figure could reflect a simultaneous decrease in the prices of both goods?
A) Only graph (a)
B) Only graph (d)
C) Graph (b) or graph (c)
D) None of the graphs in the figure can reflect this.
Correct Answer:

Verified
Correct Answer:
Verified
Q75: Figure 21-4 <img src="https://d2lvgg3v3hfg70.cloudfront.net/TB7555/.jpg" alt="Figure 21-4
Q76: Figure 21-5 <img src="https://d2lvgg3v3hfg70.cloudfront.net/TB7555/.jpg" alt="Figure 21-5
Q77: Alicia is a vegetarian, so she does
Q78: What is significant about a point on
Q79: Figure 21-14 <img src="https://d2lvgg3v3hfg70.cloudfront.net/TB7555/.jpg" alt="Figure 21-14
Q81: If consumers purchase more of a good
Q82: The marginal rate of substitution is the
Q83: For Brent, the income effect of a
Q84: A typical indifference curve is upward sloping.
Q85: For Meg, the substitution effect of an