Multiple Choice
Figure 21-3
In each case, the budget constraint moves from BC1 to BC2.
Graph (a)
Graph (b)
Graph (c)
Graph (d) 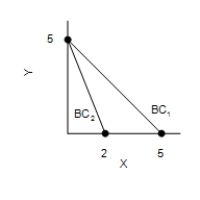
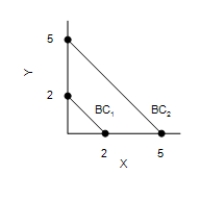
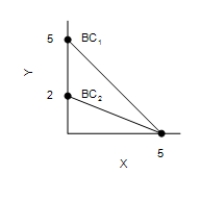
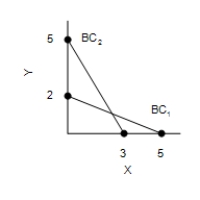
-Refer to Figure 21-3. Which of the graphs in the figure could reflect a simultaneous increase in the price of good X and decrease in the price of good Y?
A) Graph (a)
B) Graph (b)
C) Graph (c)
D) Graph (d)
Correct Answer:

Verified
Correct Answer:
Verified
Q63: Giffen goods are inferior goods for which
Q64: A consumer's optimal choice is affected by
Q65: If the market is offering consumers the
Q66: Figure 21-19<br>The figure shows three indifference curves
Q67: Both Diana and Sarah like Classical music
Q69: Figure 21-1 <img src="https://d2lvgg3v3hfg70.cloudfront.net/TB7555/.jpg" alt="Figure 21-1
Q70: A worker with a backward-bending labor supply
Q71: Figure 21-11 <img src="https://d2lvgg3v3hfg70.cloudfront.net/TB7555/.jpg" alt="Figure 21-11
Q72: All of the following are properties of
Q73: A rational person can have a negatively-sloped