Multiple Choice
Figure 21-7
The following graph shows three possible indifference curves (I) for a consumer. 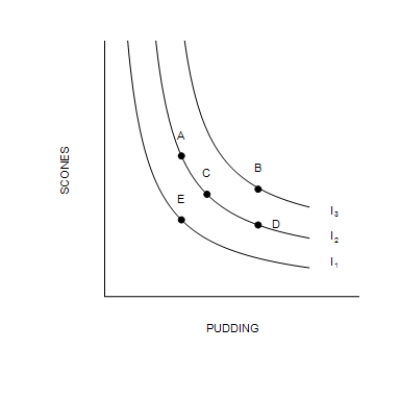
-Refer to Figure 21-7. When comparing bundle A to bundle C, the consumer
A) prefers bundle A because it contains more scones.
B) is indifferent between the two bundles.
C) prefers bundle C because it contains more pudding.
D) In order to compare bundle A to bundle C, we must know the prices of scones and pudding.
Correct Answer:

Verified
Correct Answer:
Verified
Q114: "Left" gloves and "right" gloves provide a
Q115: If a good is a Giffen good,
Q116: Suppose an individual knows that the marginal
Q117: Liana consumes only beer and chips. Her
Q118: A consumer's budget constraint is drawn on
Q120: Figure 21-12 <img src="https://d2lvgg3v3hfg70.cloudfront.net/TB7555/.jpg" alt="Figure 21-12
Q121: A consumer consumes two normal goods, popcorn
Q122: For Antonio, the income effect of an
Q123: Teresa faces prices of $6.00 for a
Q124: The indifference curves for perfect substitutes are