Multiple Choice
Figure 21-7
The following graph shows three possible indifference curves (I) for a consumer. 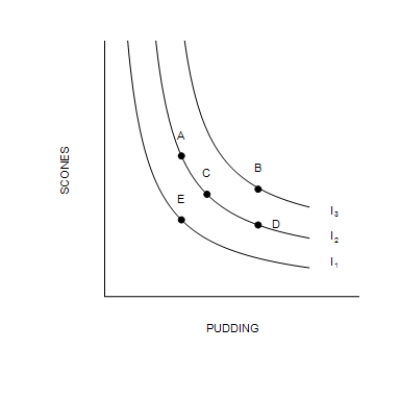
-Refer to Figure 21-7. A person who chooses to consume bundle D is likely to
A) receive higher total satisfaction at bundle D than at bundle A.
B) spend more on bundle D than bundle A.
C) receive higher marginal utility from pudding than from scones.
D) receive higher marginal utility from scones than from pudding.
Correct Answer:

Verified
Correct Answer:
Verified
Q199: If goods X and Y are both
Q200: The slope of the budget constraint reveals
Q201: A family on a trip budgets $800
Q202: Bundle J contains 10 units of good
Q203: Figure 21-1 <img src="https://d2lvgg3v3hfg70.cloudfront.net/TB7555/.jpg" alt="Figure 21-1
Q205: Joseph is planning ahead for retirement and
Q206: When indifference curves are downward sloping, the
Q207: If a consumer purchases more of good
Q208: Figure 21-16<br>The following figure illustrates the preferences
Q209: Consumers face tradeoffs except at the point