Multiple Choice
Figure 21-13 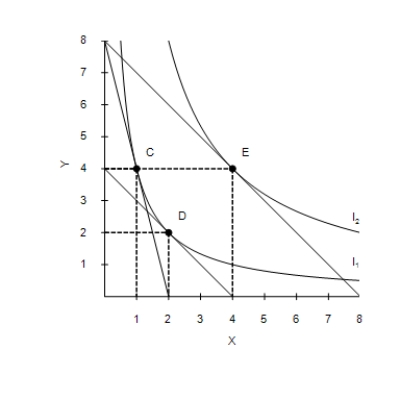
-Refer to Figure 21-13. When the price of X is $40, the price of Y is $10, and the consumer's income is $80, the consumer's optimal choice is C. Then the price of X decreases to $10. The income effect can be illustrated as the movement from
A) C to E.
B) C to D.
C) D to E.
D) E to C.
Correct Answer:

Verified
Correct Answer:
Verified
Q142: The marginal rate of substitution is the
Q143: Figure 21-14 <img src="https://d2lvgg3v3hfg70.cloudfront.net/TB7555/.jpg" alt="Figure 21-14
Q144: If a consumer purchases more of good
Q145: A consumer's budget constraint is drawn with
Q146: A good is a normal good if
Q148: Figure 21-15 <img src="https://d2lvgg3v3hfg70.cloudfront.net/TB7555/.jpg" alt="Figure 21-15
Q149: Figure 21-19<br>The figure shows three indifference curves
Q150: A budget constraint illustrates bundles that a
Q151: A typical consumer consumes both coffee and
Q152: Giffen goods violate the law of demand.