Multiple Choice
Figure 20-1
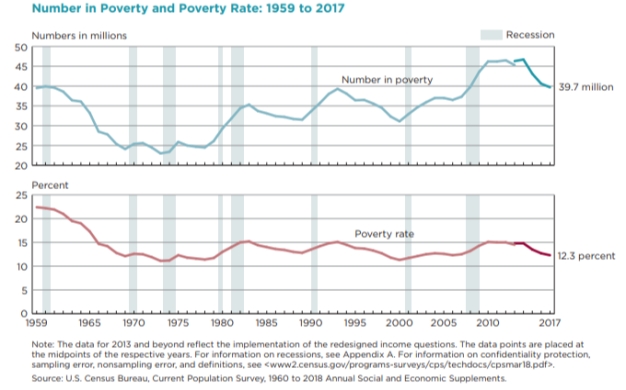
-Refer to Figure 20-1. Between 1959 and 2017 the poverty rate has
A) increased overall.
B) decreased overall.
C) stayed the same overall.
D) moved in the opposite direction of the number of people in poverty.
Correct Answer:

Verified
Correct Answer:
Verified
Q52: Which political philosophy argues that the government
Q53: Marco earns more than Antonio. A legislator
Q54: The United States has a more equal
Q55: Table 20-4<br><br> <img src="https://d2lvgg3v3hfg70.cloudfront.net/TB7555/.jpg" alt="Table 20-4
Q56: Which of the following statements is not
Q58: Table 20-8<br>Income Inequality in the United
Q59: Which group (or groups) would be the
Q60: Scenario 20-3<br>Suppose the government implemented a negative
Q61: What measure does the federal government use
Q62: The United States has more income inequality