Multiple Choice
Figure 18-5 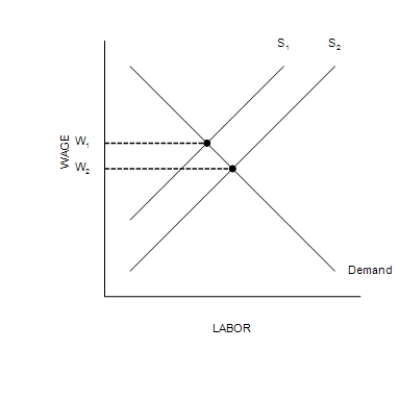
-Refer to Figure 18-5. If the relevant labor supply curve is S2 and the current wage is W1,
A) there is a surplus of labor.
B) the quantity of labor demanded exceeds the quantity of labor supplied.
C) an increase in the minimum wage could restore equilibrium in the market.
D) firms will need to raise the wage to restore equilibrium.
Correct Answer:

Verified
Correct Answer:
Verified
Q4: Figure 18-6 <img src="https://d2lvgg3v3hfg70.cloudfront.net/TB7555/.jpg" alt="Figure 18-6
Q5: Table 18-6<br>Consider the following daily production
Q6: Which of the following would shift a
Q7: A profit-maximizing competitive firm will hire workers
Q8: Figure 18-1 <img src="https://d2lvgg3v3hfg70.cloudfront.net/TB7555/.jpg" alt="Figure 18-1
Q10: Bill is a laborer. What is the
Q11: Scenario 18-2<br>Gertrude Kelp owns three boats that
Q12: Average productivity can be measured as total
Q13: Table 18-6<br>Consider the following daily production
Q14: Figure 18-8<br>The figure shows the relationship between