Multiple Choice
Figure 16-1
Graph (a) 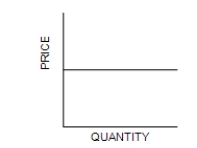
Graph (b) 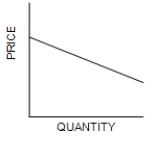
Graph (c) 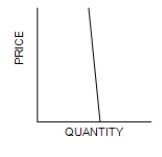
-Refer to Figure 16-1. Which of the graphs illustrates the demand curve most likely faced by a firm in a monopolistically competitive market?
A) Graph (a)
B) Graph (b)
C) Graph (c)
D) Graph (d)
Correct Answer:

Verified
Correct Answer:
Verified
Q129: Economists measure a market's domination by a
Q130: In the short run, a firm in
Q131: Table 16-1<br>The following table shows the
Q132: Figure 16-11<br> <img src="https://d2lvgg3v3hfg70.cloudfront.net/TB7555/.jpg" alt="Figure 16-11
Q133: Figure 16-5<br>The figure is drawn for a
Q135: The product-variety externality and the business-stealing externality
Q136: Figure 16-12<br> <img src="https://d2lvgg3v3hfg70.cloudfront.net/TB7555/.jpg" alt="Figure 16-12
Q137: Use a graph to demonstrate why a
Q138: In monopolistically competitive markets, positive economic profits<br>A)suggest
Q139: According to one theory, advertising sends a