Multiple Choice
Figure 14-4
In the following figure, graph (a) depicts the linear marginal cost (MC) of a firm in a competitive market, and graph (b) depicts the linear market supply curve for a market with a fixed number of identical firms.
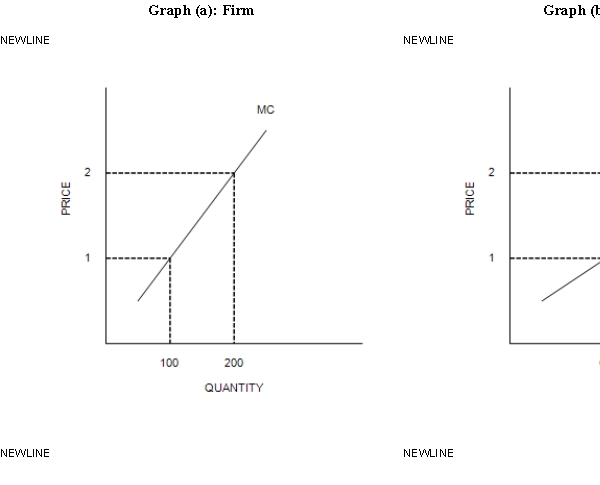
-Refer to Figure 14-4. If there are 100 identical firms in this market, what is the value of Q2?
A) 10,000
B) 20,000
C) 40,000
D) 80,000
Correct Answer:

Verified
Correct Answer:
Verified
Q199: When an individual firm in a competitive
Q200: If a firm can influence the market
Q201: Figure 14-7<br><br> <img src="https://d2lvgg3v3hfg70.cloudfront.net/TB7555/.jpg" alt="Figure 14-7
Q202: A firm maximizes its profit by selling
Q203: What is the relationship between price and
Q205: Table 14-8<br>A firm in a competitive
Q206: Table 14-6<br>Suppose that a firm in
Q207: Figure 14-1<br>Suppose that a firm in a
Q208: Suppose a firm is considering producing zero
Q209: Whenever a perfectly competitive firm chooses to