Multiple Choice
Figure 14-4
In the following figure, graph (a) depicts the linear marginal cost (MC) of a firm in a competitive market, and graph (b) depicts the linear market supply curve for a market with a fixed number of identical firms.
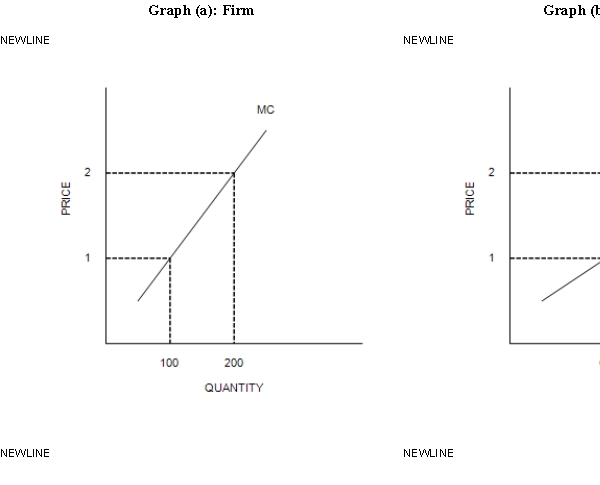
-Refer to Figure 14-4. When 100 identical firms participate in this market, at what price will 15,000 units be supplied to this market?
A) $1.00
B) $1.50
C) $2.00
D) The price cannot be determined from the information provided.
Correct Answer:

Verified
Correct Answer:
Verified
Q129: Figure 14-2<br>Suppose a firm operating in a
Q130: Figure 14-7<br><br> <img src="https://d2lvgg3v3hfg70.cloudfront.net/TB7555/.jpg" alt="Figure 14-7
Q131: The idea of "spilt milk" is associated
Q132: A competitive market has two basic characteristics.
Q133: In the long run with free entry
Q135: Figure 14-3<br>Suppose a firm operating in a
Q136: Table 14-2<br>The table represents a demand
Q137: Explain how a firm in a competitive
Q138: Consider a competitive market with a large
Q139: Which of the following represents the firm's