Multiple Choice
Figure 13-1 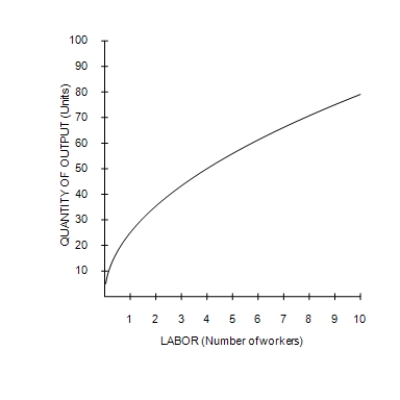
-Refer to Figure 13-1. The graph illustrates a typical
A) total-cost curve.
B) production function.
C) production possibilities frontier.
D) marginal product of labor curve.
Correct Answer:

Verified
Correct Answer:
Verified
Q233: Suppose a certain firm is able to
Q234: Scenario 13-3<br>Diamond is an organic brocolli farmer,
Q235: If an industry exhibits economies of scale,
Q236: Table 13-14<br> <span class="ql-formula" data-value="\begin{array}
Q237: Diminishing marginal product exists when the total
Q239: Describe the difference between the short run
Q240: Figure 13-5 <img src="https://d2lvgg3v3hfg70.cloudfront.net/TB7555/.jpg" alt="Figure 13-5
Q241: Total cost is the<br>A)amount a firm receives
Q242: Suppose that for a particular business there
Q243: Variable costs usually change as the firm