Multiple Choice
Figure 13-2 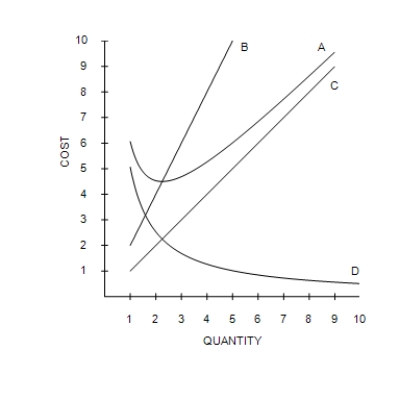
-Refer to Figure 13-2. Which of the curves is most likely to represent marginal cost?
A) Curve A
B) Curve C
C) Curve D
D) Curve B
Correct Answer:

Verified
Correct Answer:
Verified
Related Questions
Q41: Average variable cost will decrease if _.
Q42: Which of the following statements is correct?<br>A)Assuming
Q43: Marginal cost is equal to average total
Q44: What effect, if any, does diminishing marginal
Q45: Economies of scale commonly arise because of
Q47: If the production function exhibits diminishing marginal
Q48: Figure 13-5 <img src="https://d2lvgg3v3hfg70.cloudfront.net/TB7555/.jpg" alt="Figure 13-5
Q49: Table 13-9<br><br><br> <span class="ql-formula" data-value="\begin{array}
Q50: Table 13-4<br>The following table shows the
Q51: An example of an explicit cost of