Multiple Choice
Figure 13-6
The following figure depicts average total cost functions for a firm that produces automobiles. 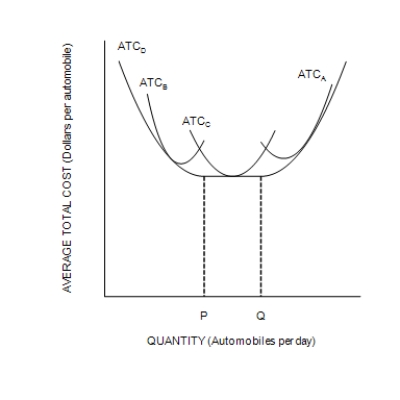
-Refer to Figure 13-6. Which of the curves is most likely to characterize the short-run average total cost curve of the smallest factory?
A) ATCB
B) ATCD
C) ATCC
D) ATCA
Correct Answer:

Verified
Correct Answer:
Verified
Q186: <img src="https://d2lvgg3v3hfg70.cloudfront.net/TB7555/.jpg" alt=" -Refer to Table
Q187: For a large firm that produces and
Q188: Figure 13-6<br>The following figure depicts average total
Q189: Economists and accountants usually disagree on the
Q190: Which of the following explains why long-run
Q192: If the average-total-cost of producing five units
Q193: Let L represent the number of workers
Q194: A second or third worker may have
Q195: Table 13-15<br> <span class="ql-formula" data-value="\begin{array}
Q196: Table 13-15<br> <span class="ql-formula" data-value="\begin{array}