Multiple Choice
Figure 13-6
The following figure depicts average total cost functions for a firm that produces automobiles. 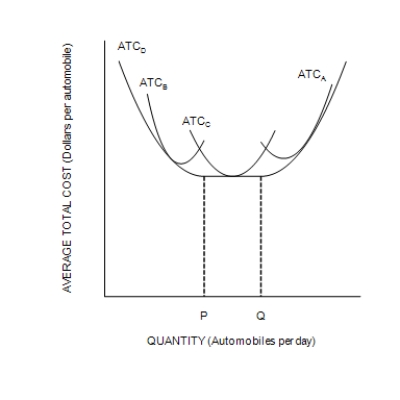
-Refer to Figure 13-6. At levels of output between P and Q, the firm experiences
A) economies of scale.
B) diseconomies of scale.
C) constant returns to scale.
D) both the benefits of specialization and diminishing marginal productivity.
Correct Answer:

Verified
Correct Answer:
Verified
Q147: When average total cost is above marginal
Q148: In the short run, a firm that
Q149: Table 13-2<br><br><br> <span class="ql-formula" data-value="\begin{array}
Q150: Figure 13-3 <img src="https://d2lvgg3v3hfg70.cloudfront.net/TB7555/.jpg" alt="Figure 13-3
Q151: In the short run, if a firm
Q153: Figure 13-3 <img src="https://d2lvgg3v3hfg70.cloudfront.net/TB7555/.jpg" alt="Figure 13-3
Q154: Describe how an accounting firm could experience
Q155: Firms may experience diseconomies of scale when<br>A)they
Q156: If the average total cost curve is
Q157: Consider a small hair styling salon. List