Multiple Choice
Figure 10-1 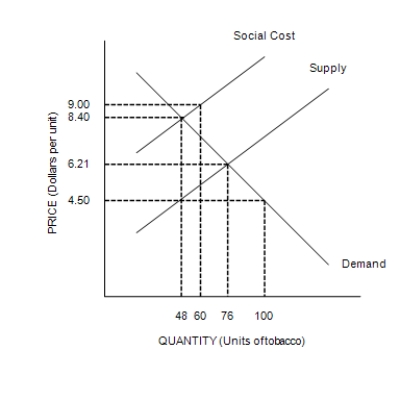
-Refer to Figure 10-1. This graph represents the tobacco industry. The socially optimal price and quantity are
A) $9.00 and 60 units, respectively.
B) $8.40 and 48 units, respectively.
C) $6.21 and 76 units, respectively.
D) $4.50 and 100 units, respectively.
Correct Answer:

Verified
Correct Answer:
Verified
Q2: Figure 10-2 <img src="https://d2lvgg3v3hfg70.cloudfront.net/TB7555/.jpg" alt="Figure 10-2
Q3: Suppose that cookie producers create a positive
Q4: The social cost of pollution includes the
Q5: Figure 10-2 <img src="https://d2lvgg3v3hfg70.cloudfront.net/TB7555/.jpg" alt="Figure 10-2
Q6: The majority of economists believe that the
Q8: Suppose a certain good conveys either an
Q9: Scenario 10-1<br>The demand curve for gasoline slopes
Q10: A former senator remarked that "We cannot
Q11: Figure 10-2 <img src="https://d2lvgg3v3hfg70.cloudfront.net/TB7555/.jpg" alt="Figure 10-2
Q12: When a transaction between a buyer and