Multiple Choice
Figure 10-4
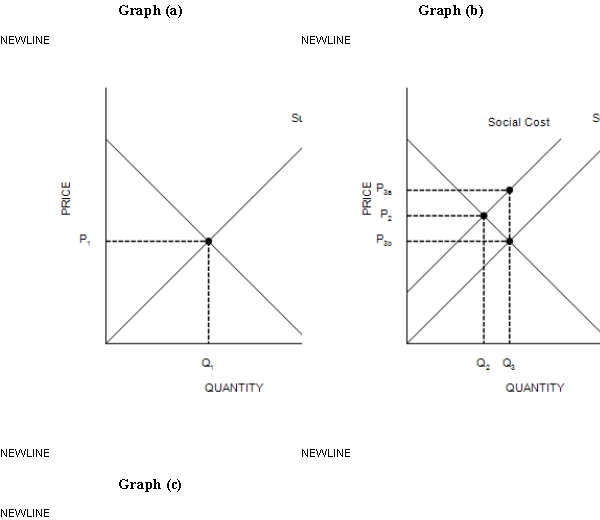
-Refer to Figure 10-4. Which graph represents a market with no externality?
A) Graph (a)
B) Graph (b) only
C) Graph (c) only
D) Graphs (b) and (c)
Correct Answer:

Verified
Correct Answer:
Verified
Related Questions
Q17: When correcting for an externality, command-and-control policies
Q18: An example of a private solution to
Q19: In some situations, private economic actors cannot
Q20: Many charities like the Sierra Club are
Q21: Which of the following is an example
Q23: Table 10-2<br><br><br> <span class="ql-formula" data-value="\begin{array}
Q24: Scenario 10-1<br>The demand curve for gasoline slopes
Q25: Suppose a new market for tradable pollution
Q26: In a market characterized by externalities, the
Q27: Some policies toward externalities provide incentives so