Multiple Choice
Figure 10-4
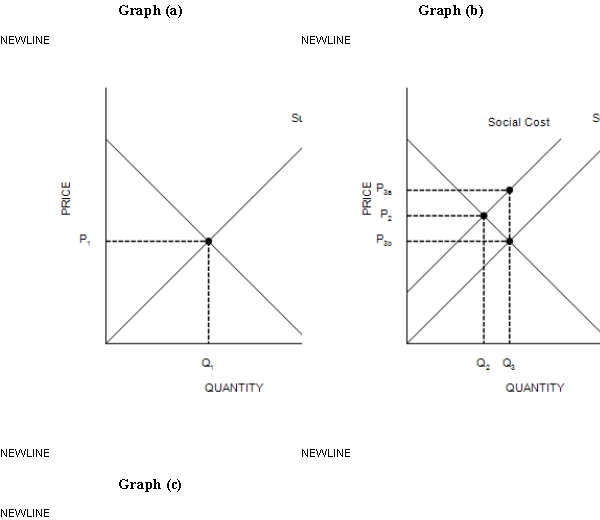
-Refer to Figure 10-4, Graph (b) and Graph (c) . The overuse of antibiotics leads to the development of antibiotic-resistant diseases. Therefore, the socially optimal quantity of antibiotics is represented by point
A) Q2.
B) Q3.
C) Q4.
D) Q5.
Correct Answer:

Verified
Correct Answer:
Verified
Q193: Assume each gallon of gasoline that is
Q194: What are the three externalities that are
Q195: Table 10-3<br><br><br> <span class="ql-formula" data-value="\begin{array}
Q196: Corrective taxes enhance efficiency, but the cost
Q197: Which of the following is NOT a
Q199: Figure 10-2 <img src="https://d2lvgg3v3hfg70.cloudfront.net/TB7555/.jpg" alt="Figure 10-2
Q200: At any given quantity, the willingness to
Q201: Beverly owns a rabbit and receives a
Q202: Does the restoration of historic buildings create
Q203: Figure 10-2 <img src="https://d2lvgg3v3hfg70.cloudfront.net/TB7555/.jpg" alt="Figure 10-2