Essay
Figure 9-7
The following diagram shows the domestic demand and domestic supply curves in a market. 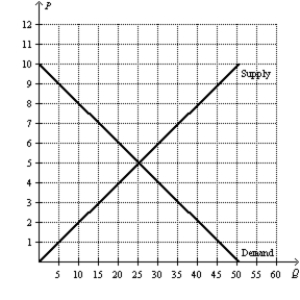
-Refer to Figure 9-7. Suppose the world price in this market is $7. If the country allows free trade, how many units will domestic consumers demand, and how many units will domestic producers produce?
Correct Answer:

Verified
Domestic consumers w...View Answer
Unlock this answer now
Get Access to more Verified Answers free of charge
Correct Answer:
Verified
View Answer
Unlock this answer now
Get Access to more Verified Answers free of charge
Q155: The nation of Cranolia used to prohibit
Q156: The nation of Aviana soon will abandon
Q157: Figure 9-6 <img src="https://d2lvgg3v3hfg70.cloudfront.net/TB7555/.jpg" alt="Figure 9-6
Q158: Domestic consumers gain and domestic producers lose
Q159: List four benefits of international trade.
Q161: The sum of consumer and producer surplus
Q162: Free trade allows firms to realize economies
Q163: When a country allows trade and becomes
Q164: A country has a comparative advantage in
Q165: Figure 9-2 <img src="https://d2lvgg3v3hfg70.cloudfront.net/TB7555/.jpg" alt="Figure 9-2