Essay
Figure 9-8
The following diagram shows the domestic demand and supply curves in a market. Assume that the world price in this market is $20 per unit. 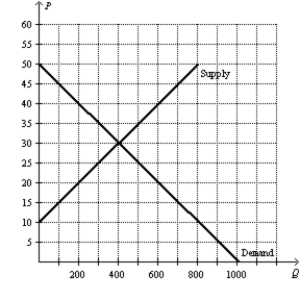
-Refer to Figure 9-8. If the country allows free trade, will the country import or export this good, and how many units will be imported/exported?
Correct Answer:

Verified
With trade...View Answer
Unlock this answer now
Get Access to more Verified Answers free of charge
Correct Answer:
Verified
View Answer
Unlock this answer now
Get Access to more Verified Answers free of charge
Q139: If a country allows free trade and
Q140: Figure 9-5 <img src="https://d2lvgg3v3hfg70.cloudfront.net/TB7555/.jpg" alt="Figure 9-5
Q141: Scenario 9-1<br><br>For a small country called Boxland,
Q142: Assume, for China, that the domestic price
Q143: For Country A, the world price of
Q145: The problem with the protection-as-a-bargaining-chip argument for
Q146: If a tariff is placed on watches,
Q147: Suppose in the country of Nash that
Q148: Figure 9-8<br>The following diagram shows the domestic
Q149: Figure 9-4 <img src="https://d2lvgg3v3hfg70.cloudfront.net/TB7555/.jpg" alt="Figure 9-4