Multiple Choice
Figure 9-6 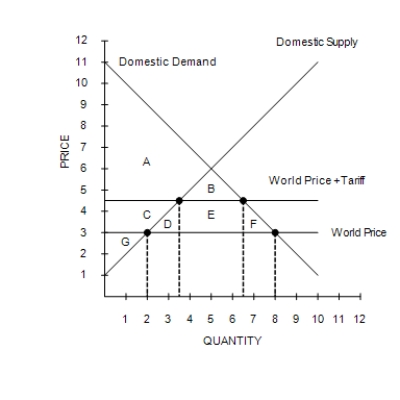
-Refer to Figure 9-6. The area C + D + E + F represents
A) the decrease in consumer surplus caused by the tariff.
B) the decrease in total surplus caused by the tariff.
C) the deadweight loss of the tariff minus government revenue raised by the tariff.
D) the deadweight loss of the tariff plus government revenue raised by the tariff.
Correct Answer:

Verified
Correct Answer:
Verified
Q58: GATT is an example of a successful
Q59: Figure 9-2 <img src="https://d2lvgg3v3hfg70.cloudfront.net/TB7555/.jpg" alt="Figure 9-2
Q60: Scenario 9-1<br><br>For a small country called Boxland,
Q61: Figure 9-1<br><br> Uganda<br><img src="https://d2lvgg3v3hfg70.cloudfront.net/TB7555/.jpg" alt="Figure 9-1
Q62: Figure 9-6 <img src="https://d2lvgg3v3hfg70.cloudfront.net/TB7555/.jpg" alt="Figure 9-6
Q64: Figure 9-6 <img src="https://d2lvgg3v3hfg70.cloudfront.net/TB7555/.jpg" alt="Figure 9-6
Q65: Figure 9-1<br><br> Uganda<br><img src="https://d2lvgg3v3hfg70.cloudfront.net/TB7555/.jpg" alt="Figure 9-1
Q66: What are the arguments in favor of
Q67: Figure 9-4 <img src="https://d2lvgg3v3hfg70.cloudfront.net/TB7555/.jpg" alt="Figure 9-4
Q68: The small country assumption is made in