Essay
Figure 8-9
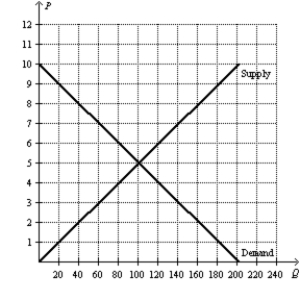
-Refer to Figure 8-9. How much is consumer surplus at the market equilibrium?
Correct Answer:

Verified
Consumer s...View Answer
Unlock this answer now
Get Access to more Verified Answers free of charge
Correct Answer:
Verified
View Answer
Unlock this answer now
Get Access to more Verified Answers free of charge
Q22: Figure 8-12<br><img src="https://d2lvgg3v3hfg70.cloudfront.net/TB7555/.jpg" alt="Figure 8-12
Q23: Total surplus in a market does not
Q24: Figure 8-10<br><br> <img src="https://d2lvgg3v3hfg70.cloudfront.net/TB7555/.jpg" alt="Figure 8-10
Q25: The more inelastic are demand and supply,
Q26: Suppose that instead of a supply-demand diagram,
Q28: The result of the large tax cuts
Q29: Figure 8-1 <img src="https://d2lvgg3v3hfg70.cloudfront.net/TB7555/.jpg" alt="Figure 8-1
Q30: Figure 8-9<br><br> <img src="https://d2lvgg3v3hfg70.cloudfront.net/TB7555/.jpg" alt="Figure 8-9
Q31: When the government imposes taxes on buyers
Q32: Figure 8-2<br>The vertical distance between points C