Multiple Choice
Figure 8-1 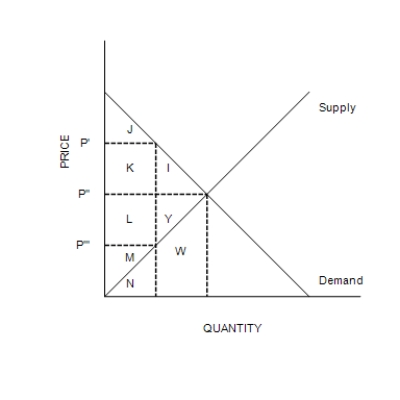
-Refer to Figure 8-1. Suppose the government imposes a tax of P'-P'''. The area measured by L + M + Y represents
A) consumer surplus after the tax.
B) consumer surplus before the tax.
C) producer surplus after the tax.
D) producer surplus before the tax.
Correct Answer:

Verified
Correct Answer:
Verified
Q170: The optimal tax is difficult to determine
Q171: Figure 8-10<br><br> <img src="https://d2lvgg3v3hfg70.cloudfront.net/TB7555/.jpg" alt="Figure 8-10
Q172: The Social Security tax is a labor
Q173: Figure 8-1 <img src="https://d2lvgg3v3hfg70.cloudfront.net/TB7555/.jpg" alt="Figure 8-1
Q174: The Laffer curve illustrates how taxes in
Q176: Suppose the demand curve and the supply
Q177: Taxes create deadweight losses.
Q178: Figure 8-2<br>The vertical distance between points C
Q179: Figure 8-10<br><br> <img src="https://d2lvgg3v3hfg70.cloudfront.net/TB7555/.jpg" alt="Figure 8-10
Q180: Refer to Scenario 8-3. Suppose that