Multiple Choice
Figure 8-2
The vertical distance between points C and D represents a tax in the market.
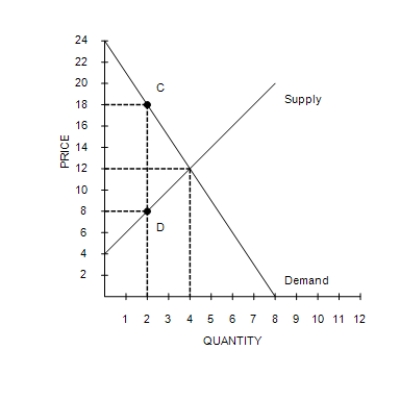
-Refer to Figure 8-2. The per-unit burden of the tax on buyers is
A) $2.
B) $6.
C) $4.
D) $12.
Correct Answer:

Verified
Correct Answer:
Verified
Q191: Use the following graph shown to
Q192: Scenario 8-1<br>Erin would be willing to pay
Q193: The demand for bread is less elastic
Q194: Suppose a tax is imposed on each
Q195: The decrease in total surplus that results
Q197: Figure 8-1 <img src="https://d2lvgg3v3hfg70.cloudfront.net/TB7555/.jpg" alt="Figure 8-1
Q198: Figure 8-2<br>The vertical distance between points C
Q199: Suppose the demand curve and the supply
Q200: Figure 8-9<br><br> <img src="https://d2lvgg3v3hfg70.cloudfront.net/TB7555/.jpg" alt="Figure 8-9
Q201: If the labor supply curve is very