Multiple Choice
Figure 8-5
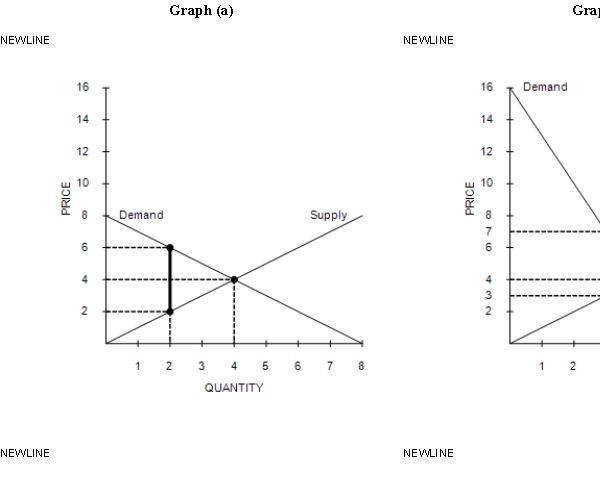
-Refer to Figure 8-5. Graph (a) and Graph (b) each illustrate a $4 tax placed on a market. In comparison to Graph (a) , Graph (b) illustrates which of the following statements?
A) When demand is relatively inelastic, the deadweight loss of a tax is smaller than when demand is relatively elastic.
B) When demand is relatively elastic, the deadweight loss of a tax is larger than when demand is relatively inelastic.
C) When supply is relatively inelastic, the deadweight loss of a tax is smaller than when supply is relatively elastic.
D) When supply is relatively elastic, the deadweight loss of a tax is larger than when supply is relatively inelastic.
Correct Answer:

Verified
Correct Answer:
Verified
Q76: A tax on insulin is likely to
Q77: Figure 8-1 <img src="https://d2lvgg3v3hfg70.cloudfront.net/TB7555/.jpg" alt="Figure 8-1
Q78: Figure 8-2<br>The vertical distance between points C
Q79: Suppose the government increases the size of
Q80: Figure 8-3<br>The vertical distance between points A
Q82: Taxes on labor tend to encourage second
Q83: When a tax is imposed on a
Q84: Figure 8-1 <img src="https://d2lvgg3v3hfg70.cloudfront.net/TB7555/.jpg" alt="Figure 8-1
Q85: Scenario 8-3<br><br>Suppose the market demand and market
Q86: Figure 8-10<br><br> <img src="https://d2lvgg3v3hfg70.cloudfront.net/TB7555/.jpg" alt="Figure 8-10