Multiple Choice
Table 7-5
-Refer to Table 7-5. You are selling extra tickets to the Midwest Regional Sweet 16 game in the men's NCAA basketball tournament. The table shows the willingness to pay of the four potential buyers in the market for a ticket to the game. Which of the following graphs represents the market demand curve?
A) 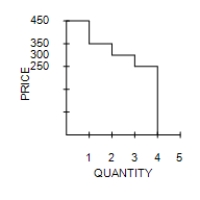
B) 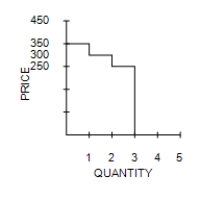
C) 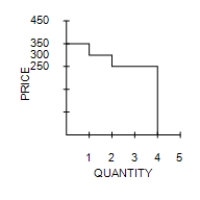
D) 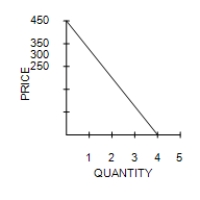
Correct Answer:

Verified
Correct Answer:
Verified
Q166: Welfare economics is the study of the
Q167: Figure 7-14<br> <img src="https://d2lvgg3v3hfg70.cloudfront.net/TB7555/.jpg" alt="Figure 7-14
Q168: Figure 7-5<br> <img src="https://d2lvgg3v3hfg70.cloudfront.net/TB7555/.jpg" alt="Figure 7-5
Q169: What happens to consumer surplus in the
Q170: Table 7-8<br><br><br> <span class="ql-formula" data-value="\begin{array}
Q172: Given the following two equations:<br>Show how equation
Q173: Which of the following will cause an
Q174: If an allocation of resources is efficient,
Q175: Figure 7-1<br> <img src="https://d2lvgg3v3hfg70.cloudfront.net/TB7555/.jpg" alt="Figure 7-1
Q176: A good weather in Spain results in