Multiple Choice
Figure 5-4
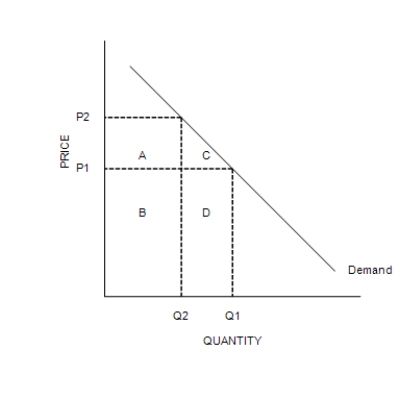
-Refer to Figure 5-4. Total revenue when the price is P1 is represented by
A) areas B + D.
B) areas A + B.
C) areas C + D.
D) area D.
Correct Answer:

Verified
Correct Answer:
Verified
Related Questions
Q156: If two goods are complements, their cross-price
Q157: Supply tends to be more elastic in
Q158: Suppose the price elasticity of demand for
Q159: The price elasticity of supply measures how
Q160: The demand for bread is likely to
Q162: Figure 5-2<br> <img src="https://d2lvgg3v3hfg70.cloudfront.net/TB7555/.jpg" alt="Figure 5-2
Q163: If marijuana were legalized, it is likely
Q164: OPEC failed to maintain a high price
Q165: The supply of a good will be
Q166: Figure 5-3<br> <img src="https://d2lvgg3v3hfg70.cloudfront.net/TB7555/.jpg" alt="Figure 5-3