Multiple Choice
Figure 4-1 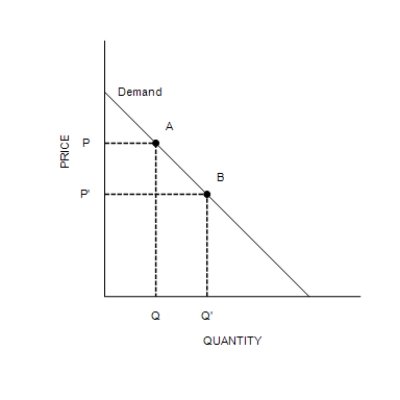
-Refer to Figure 4-1. The movement from point A to point B on the graph shows
A) a decrease in demand.
B) an increase in demand.
C) a decrease in quantity demanded.
D) an increase in quantity demanded.
Correct Answer:

Verified
Correct Answer:
Verified
Related Questions
Q196: If a seller in a competitive market
Q197: Which of the following events could cause
Q198: If a determinant of demand other than
Q199: The law of supply states that, other
Q200: When the market price is below the
Q202: A decrease in supply will cause an
Q203: A monopoly is a market with one<br>A)seller,
Q204: Does a change in the price in
Q205: Figure 4-13<br> <img src="https://d2lvgg3v3hfg70.cloudfront.net/TB7555/.jpg" alt="Figure 4-13
Q206: Suppose scientists provide evidence that people who