Multiple Choice
Figure 4-1 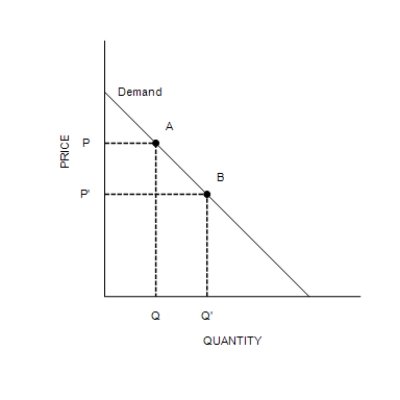
-Refer to Figure 4-1. The movement from point A to point B on the graph is caused by
A) an increase in price.
B) a decrease in price.
C) a decrease in the price of a substitute good.
D) an increase in income.
Correct Answer:

Verified
Correct Answer:
Verified
Related Questions
Q52: Table 4-7<br>The table below shows the
Q53: If something happens to alter the quantity
Q54: Suppose that demand for a good increases
Q55: Price will rise to eliminate a shortage.
Q56: The quantity supplied of a good or
Q58: A decrease in demand shifts the demand
Q59: Advances in production technology typically reduce firms'
Q60: Sellers respond to a surplus by cutting
Q61: Table 4-3<br><br> <span class="ql-formula" data-value="\begin{array}
Q62: The line that relates the price of