Multiple Choice
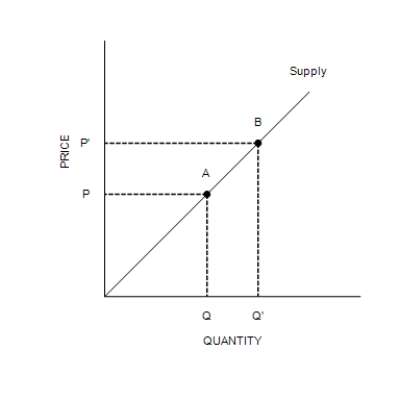
Figure 4-4 
-Refer to Figure 4-4. The movement from point A to point B on the graph is called
A) a decrease in supply.
B) an increase in supply.
C) an increase in the quantity supplied.
D) a decrease in the quantity supplied.
Correct Answer:

Verified
Correct Answer:
Verified
Related Questions
Q228: A yard sale is an example of
Q229: If a surplus exists in a market,
Q230: Figure 4-9 <img src="https://d2lvgg3v3hfg70.cloudfront.net/TB7555/.jpg" alt="Figure 4-9
Q231: A market is a group of buyers
Q232: Suppose the income of buyers in a
Q234: Since individual buyers and individual sellers in
Q235: The law of demand states that, other
Q236: An increase in demand will cause an
Q237: Scenario 4-1<br>Suppose the demand schedule in a
Q238: Equilibrium price must increase when<br>A)both demand and