Multiple Choice
Figure 3-1
Graph (a)
Graph (b)
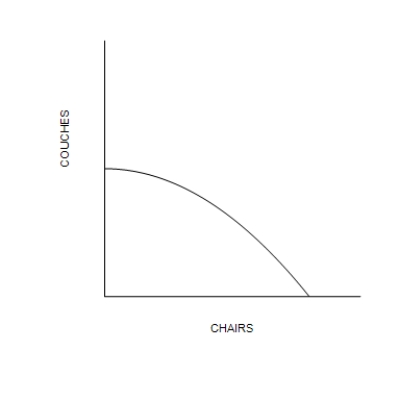
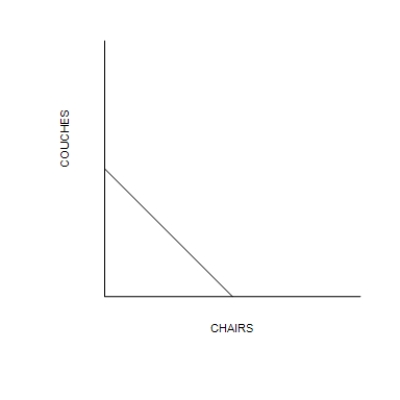
-Refer to Figure 3-1. The rate of trade-off between producing chairs and producing couches is constant in
A) Graph (a) only.
B) Graph (b) only.
C) both Graph (a) and graph (b) .
D) neither Graph (a) nor Graph (b) .
Correct Answer:

Verified
Correct Answer:
Verified
Q27: Absolute advantage is found by comparing different
Q28: International trade may make some individuals in
Q29: Adam Smith wrote that a person should
Q30: For both parties to gain from trade,
Q31: Fred trades 2 tomatoes to Barney in
Q33: Table 3-11<br>Assume that Bahamas and Denmark can
Q34: Figure 3-7<br>Mary's Production Possibilities Frontier Kate's Production
Q35: A professor spends 8 hours per day
Q36: The producer that requires a smaller quantity
Q37: Trade can make everybody better off because