Multiple Choice
Figure 3-1
Graph (a)
Graph (b)
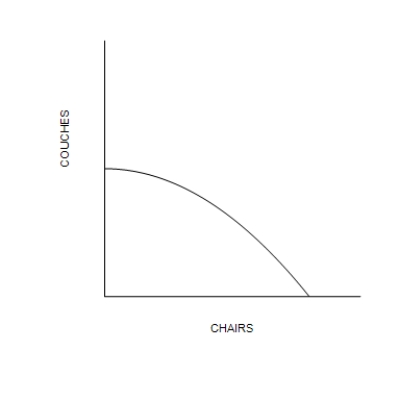
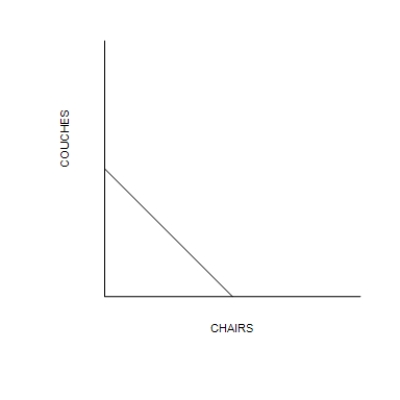
-Refer to Figure 3-1. The rate of trade-off between producing chairs and producing couches depends on how many chairs and couches are being produced in
A) Graph (a) only.
B) Graph (b) only.
C) both Graph (a) and Graph (b) .
D) neither Graph (a) nor Graph (b) .
Correct Answer:

Verified
Correct Answer:
Verified
Q84: What does a consumption possibilities frontier represent?
Q85: An assumption of the production possibilities frontier
Q86: Trade between countries<br>A)allows each country to consume
Q87: Table 3-9 Summary of the Gains from
Q88: Figure 3-6<br>The production possibilities frontiers below show
Q90: Some countries win in international trade, while
Q91: Differences in opportunity cost allow for gains
Q92: Figure 3-3<br> <img src="https://d2lvgg3v3hfg70.cloudfront.net/TB7555/.jpg" alt="Figure 3-3
Q93: The production possibilities frontier shows the trade-offs
Q94: Figure 3-3<br> <img src="https://d2lvgg3v3hfg70.cloudfront.net/TB7555/.jpg" alt="Figure 3-3