Short Answer
Match each of the following costs with the graph (a-e) that best portrays its cost behavior as the number of units produced and sold increases. 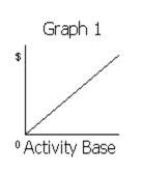
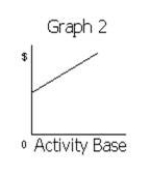
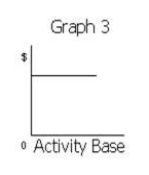
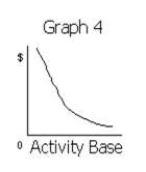
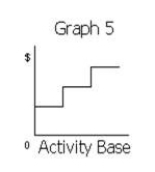
-Straight-line depreciation on factory equipment
A)Graph 1
B)Graph 2
C)Graph 3
D)Graph 4
E)Graph 5
Correct Answer:

Verified
Correct Answer:
Verified
Q1: The systematic examination of the relationships among
Q3: Figure 1 <img src="https://d2lvgg3v3hfg70.cloudfront.net/TB7934/.jpg" alt="Figure 1
Q4: A firm operated at 80% of capacity
Q7: Given the following cost and activity observations
Q8: Which of the following ratios indicates the
Q9: Grant Company has sales of $300,000, and
Q10: Figure 1 <img src="https://d2lvgg3v3hfg70.cloudfront.net/TB7934/.jpg" alt="Figure 1
Q11: Atlantic Company sells a product with a
Q180: The reliability of cost-volume-profit analysis does not
Q182: A low operating leverage is normal for