Essay
Refer to the figure below. Suppose that the supply curve is constant at $10. Suppose further that the before-tax demand curve DB can be written as B = 20 - P/2, where B is the number of structures per year and P is the price.
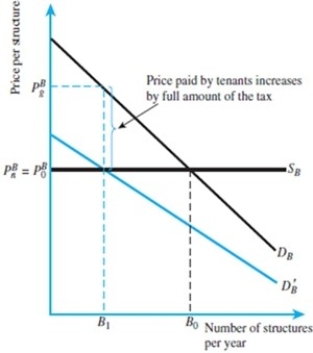 (A)Find B0.
(B)Suppose that the after-tax demand curve,  , can be written as B = 20 - P. Find B1 and
  .
.
Correct Answer:

Verified
(A)Insert $10 into before-tax demand equ...View Answer
Unlock this answer now
Get Access to more Verified Answers free of charge
Correct Answer:
Verified
View Answer
Unlock this answer now
Get Access to more Verified Answers free of charge
Q7: There is no federal property tax in
Q8: Property tax in Canada is predominately a
Q9: Bob and Doug both own properties with
Q10: The traditional view is that property tax
Q11: The assessment ratio is<br>A)the tax liability to
Q13: Property tax as a user fee implies
Q14: The property tax receives criticism because<br>A)it is
Q16: In the traditional view, the supply curve
Q17: Refer to the figure below. Suppose that
Q22: Property taxes are not very popular.People might