Multiple Choice
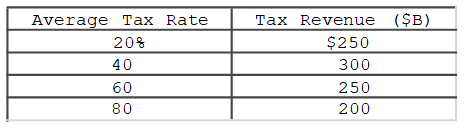
If graphed, the relationship shown would depict this economy's
A) Laffer Curve.
B) Lorenz Curve.
C) Tax Freedom Curve.
D) Phillips Curve.
Correct Answer:

Verified
Correct Answer:
Verified
Related Questions
Q2: The short-run aggregate supply curve shifts to
Q104: Which presidential administration is most closely associated
Q105: Disinflation can be explained by the Phillips
Q106: In the long run, demand-pull inflation<br>A)starts out
Q107: One criticism against supply-side cuts in marginal
Q109: The long-run Phillips Curve is vertical at<br>A)a
Q110: A Congressional representative who calls for a
Q111: The traditional Phillips Curve suggests a trade-off
Q112: The long-run aggregate supply curve is vertical<br>A)because
Q113: One implication of the Laffer Curve in