Multiple Choice
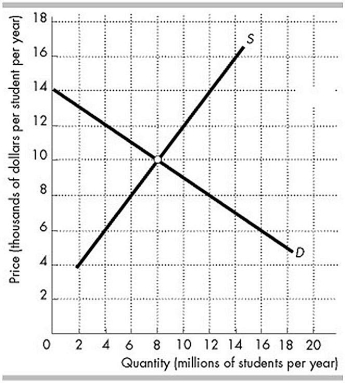 The figure above shows the supply curve (S) and the demand curve (D) for university education. The external benefit from university education is $6,000 per student per year and is constant.
-In the figure above, with no government involvement and if the universities are competitive, what is the deadweight loss?
A) $6 billion per year
B) $12 billion per year
C) $4 billion per year
D) Zero
Correct Answer:

Verified
Correct Answer:
Verified
Q42: Marginal benefit received by people other than
Q43: When external benefits are present,<br>A) property rights
Q44: <img src="https://d2lvgg3v3hfg70.cloudfront.net/TB4952/.jpg" alt=" -In the above
Q45: The benefit from an additional unit of
Q48: An uncrowded toll road is _ because
Q49: <img src="https://d2lvgg3v3hfg70.cloudfront.net/TB4952/.jpg" alt=" -The above figure
Q50: Food is an example of a _
Q51: If the marginal social benefit of a
Q52: Free riding<br>A) is possible if the consumption
Q65: <img src="https://d2lvgg3v3hfg70.cloudfront.net/TB8586/.jpg" alt=" -Suppose two individuals,