Multiple Choice
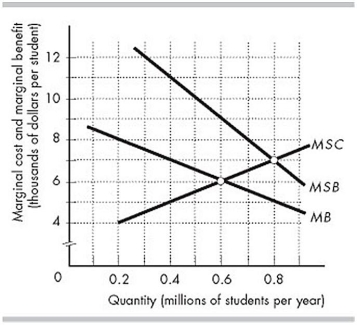
-The figure above shows the marginal social costs (MSC) , marginal private benefits (MB) , and marginal social benefits (MSB) of university education in Inland. The efficient level of university enrolment in Inland is
A) 0.5 million students per year.
B) 0.8 million students per year.
C) 0.6 million students per year.
D) 0.7 million students per year.
Correct Answer:

Verified
Correct Answer:
Verified
Q98: The efficient quantity of a public good
Q99: <img src="https://d2lvgg3v3hfg70.cloudfront.net/TB4952/.jpg" alt=" -Tom and Jerry
Q100: <img src="https://d2lvgg3v3hfg70.cloudfront.net/TB4952/.jpg" alt=" -The above figure
Q101: Nonrivalry is a feature of<br>A) all nonexcludable
Q102: Nonexcludability is a feature of<br>A) goods but
Q104: The benefit from an additional unit of
Q105: A movie shown on a pay- per-
Q106: <img src="https://d2lvgg3v3hfg70.cloudfront.net/TB4952/.jpg" alt=" -Tom and Jerry
Q107: Consider a market in which there is
Q108: Which of the following is the BEST