Multiple Choice
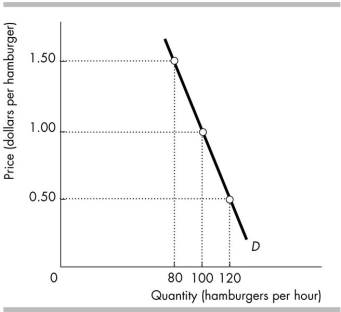
-The above figure illustrates the demand for hamburgers. When the price is $1 a hamburger, the elasticity of demand is _______ and a 1 per cent increase in the price will _______ the quantity of hamburgers demanded by _______ per cent.
A) 1.00; decrease; 0.40
B) 2.50; increase; 2.50
C) 5.00; decrease; 5.00
D) 0.40; decrease; 0.40
Correct Answer:

Verified
Correct Answer:
Verified
Q29: If the price of one good increases
Q30: The price elasticity of demand for furniture
Q31: When the price of perfume changes from
Q32: Suppose the price of burgers increases from
Q33: <img src="https://d2lvgg3v3hfg70.cloudfront.net/TB4952/.jpg" alt=" -The table above
Q35: A 20 per cent increase in the
Q36: The price elasticity of demand is 5.0
Q37: A rise in the price of good
Q38: Dan sells newspapers. Dan says that a
Q39: The income elasticity of demand is largest