Multiple Choice

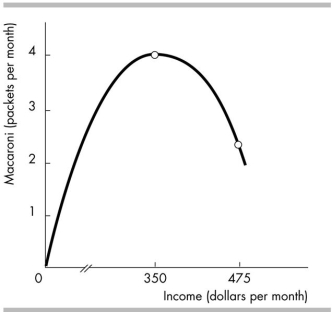
-The figure shows the relationship between Moira's income and the quantity of macaroni that she demands. When income is less than $350 per month, macaroni
A) is a normal good.
B) has many substitutes.
C) has negative income elasticity.
D) is an inferior good.
Correct Answer:

Verified
Correct Answer:
Verified
Related Questions
Q118: For electricity, natural gas, or other forms
Q119: Which of the following items will have
Q120: Demand is inelastic when a price _
Q121: Which of the following statements is FALSE?<br>A)
Q122: If a 10 per cent increase in
Q124: The concept of elasticity of supply measures
Q125: If the cross elasticity of demand between
Q126: If tea and coffee are substitutes, the
Q127: Producers' total revenue will increase if<br>A) the
Q128: If a 5 per cent increase in