Multiple Choice
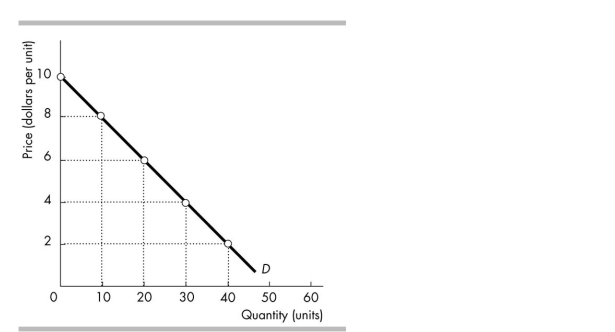
-The figure above illustrates a linear demand curve. By comparing the price elasticity in the $2 to $4 price range with the elasticity in the $8 to $10 range, you can conclude that the elasticity is
A) the same in both price ranges.
B) greater in the $2 to $4 range.
C) greater in the $8 to $10 range.
D) greater in the $8 to $10 range when the price rises but greater in the $2 to $4 range when the price falls.
Correct Answer:

Verified
Correct Answer:
Verified
Q88: A straight- line demand curve with negative
Q89: Using the average price and average quantity,
Q90: <img src="https://d2lvgg3v3hfg70.cloudfront.net/TB4952/.jpg" alt=" -The above figure
Q91: If a price hike of 5 per
Q92: If the demand for a good is
Q94: When the price elasticity of demand for
Q95: Suppose the quantity demanded is 5 units
Q96: If, when income increases by 2 per
Q97: The demand for movies is unit elastic
Q98: Last year when John graduated and received