Multiple Choice
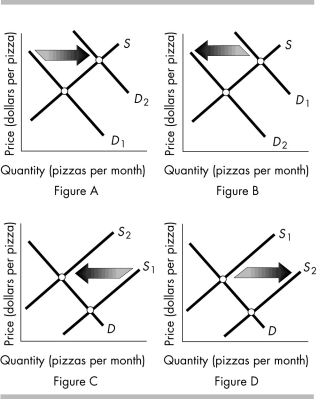
-The above figure shows the market for pizza. Which figure shows the effect of an increase in the price of the tomato sauce used to produce pizza?
A) Figure A
B) Figure B
C) Figure C
D) Figure D
Correct Answer:

Verified
Correct Answer:
Verified
Related Questions
Q338: Cupcakes and granola bars are substitutes in
Q339: <img src="https://d2lvgg3v3hfg70.cloudfront.net/TB8586/.jpg" alt=" -The above figure
Q340: Each point on the demand curve reflects<br>A)
Q341: If the demand curve for bikes shifts
Q342: You can buy a season ticket to
Q344: Pizza and hamburgers are substitutes for consumers.
Q345: A fall in the price of wheat
Q346: There are 72,922 seats in Lambeau Field
Q347: The equilibrium price is the price at
Q348: Which of the following explains why supply