Multiple Choice
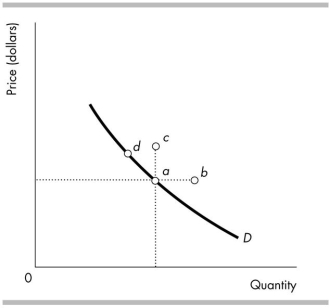
-In the above figure, an increase in the quantity demanded is represented by a movement from point d to
A) both points b and c.
B) point b only.
C) point c only.
D) point a.
Correct Answer:

Verified
Correct Answer:
Verified
Related Questions
Q41: Leather belts and leather shoes are substitutes
Q96: How many sides does a market have?<br>A)
Q98: Flights to Paris are a normal good
Q99: <img src="https://d2lvgg3v3hfg70.cloudfront.net/TB4952/.jpg" alt=" -The above table
Q100: A change in which of the following
Q100: When the price of a good is<br>A)above
Q104: If the price of a CD is
Q105: Good A and good B are substitutes
Q106: Which of the following shifts the supply
Q349: The quantity supplied of a good or