Multiple Choice
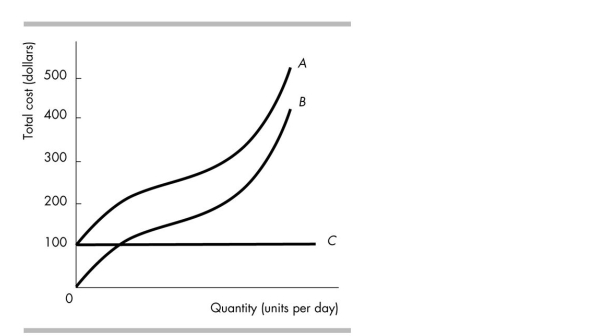
-In the above figure, the total variable cost curve is curve
A) A.
B) B.
C) C.
D) None of the curves in the figure.
Correct Answer:

Verified
Correct Answer:
Verified
Q116: Electric utility companies have built larger and
Q117: <img src="https://d2lvgg3v3hfg70.cloudfront.net/TB4952/.jpg" alt=" -The table above
Q118: <img src="https://d2lvgg3v3hfg70.cloudfront.net/TB4952/.jpg" alt=" -In the above
Q119: Points below a firm's total product curve
Q120: The total output produced with any quantity
Q122: <img src="https://d2lvgg3v3hfg70.cloudfront.net/TB4952/.jpg" alt=" -The above table
Q123: As output increases, total cost _ ,
Q124: <img src="https://d2lvgg3v3hfg70.cloudfront.net/TB4952/.jpg" alt=" -The above figure
Q125: By using more labour to produce more
Q126: After constructing a new factory, the cost