Multiple Choice
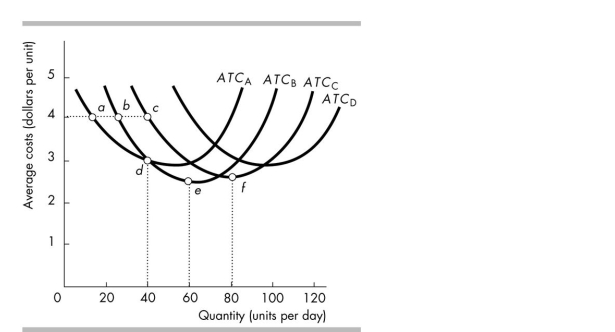
-The average total cost curves for plants A, B, C and D are shown in the above figure. It is possible that the long- run average cost curve runs through points
A) d, e and f.
B) b, d and e.
C) a, b and c.
D) c and d.
Correct Answer:

Verified
Correct Answer:
Verified
Q40: As output increases, marginal cost will eventually<br>A)
Q41: A firm's average total cost is $60,
Q42: Which of the following statements is true?<br>A)
Q43: The marginal product of labour is the<br>A)
Q44: The long run is a time frame
Q46: The marginal product of labour is equal
Q47: In a diagram with the total cost
Q48: Total product is<br>A) the maximum output that
Q49: <img src="https://d2lvgg3v3hfg70.cloudfront.net/TB4952/.jpg" alt=" -In the above
Q50: Diminishing marginal returns to labour occur because<br>A)